You can build custom KPIsKey Performance Indicator - this is a user-defined measure used to track performance of a strategic goal, objective, plan, initiative, or business process. A KPI is evaluated against a target., and then apply them to your queries in Discover to give you additional insights about your data.
See how to create a growth percentage KPI in the steps below.
To find out how to use your KPIs, see Using KPIs.
STEP 1
Select one of the visual styles from the Style page and click next. For this example, select Reverse Signs.
When using arrow indicators, select Signs if you want the status value to be lower than the target value (for example, if your status value is returns, and the target it sales, then a low status value would indicate success).
If you want the status value to be higher than the target value, then use Reversed Signs (for example, if you want a status value of Sales to exceed a target value of Costs)

STEP 2
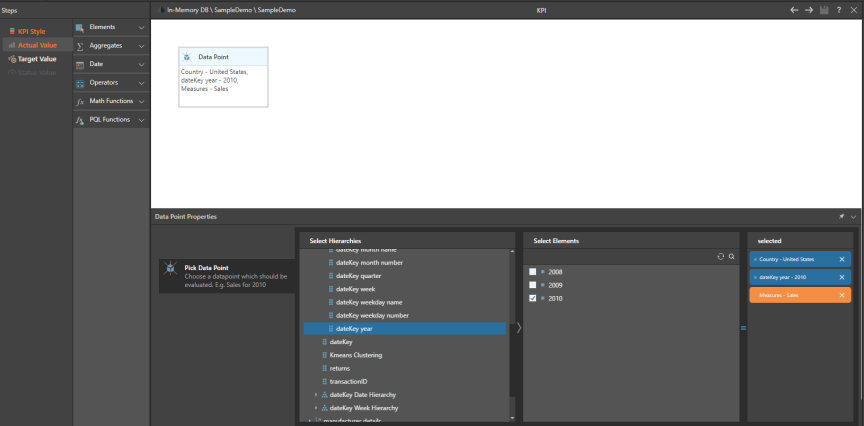
Define the actual value. This is the value you intend to measure. This may be a data point, member or set, or you can use the other available functions to define a more complex value.
STEP 3
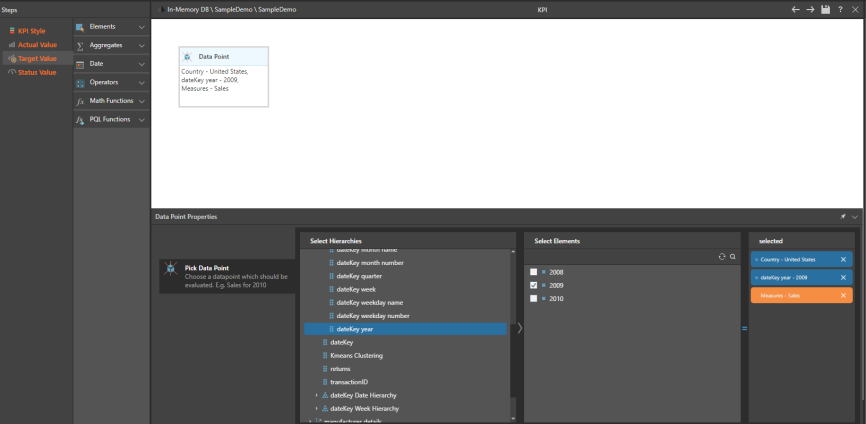
Specify a target value. This is the your goal that you want to measure your actual value against. Your target value can be a static predefined KPI, or it can be a dynamic value or calculation. For instance, in this example the target value is US sales for the previous year.
STEP 4
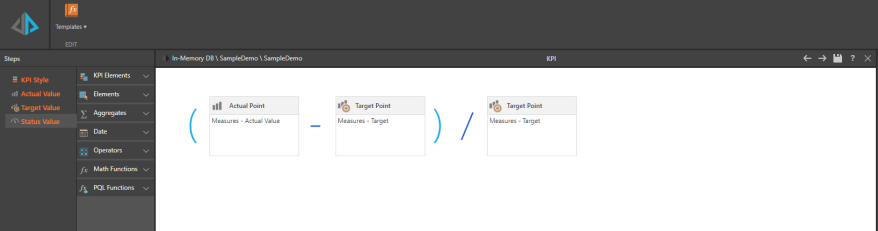
Add a status value. The status value is the calculation you want to apply to your actual and target values, to determine how the actual will be compared with the target. You can define your own calculation, or use the templates.
Click  to test your calculation, and then save.
STEP 5
Enable custom dynamic bands if required. For information about dynamic bands, click here.